1918
CONNECT - Wireless weather station
CONNECT - Wireless weather station
Note:
• Once the weather trend indicator has registered a change in air pressure, it will remain permanently visualized on the LCD.
7.3.3 Air pressure history
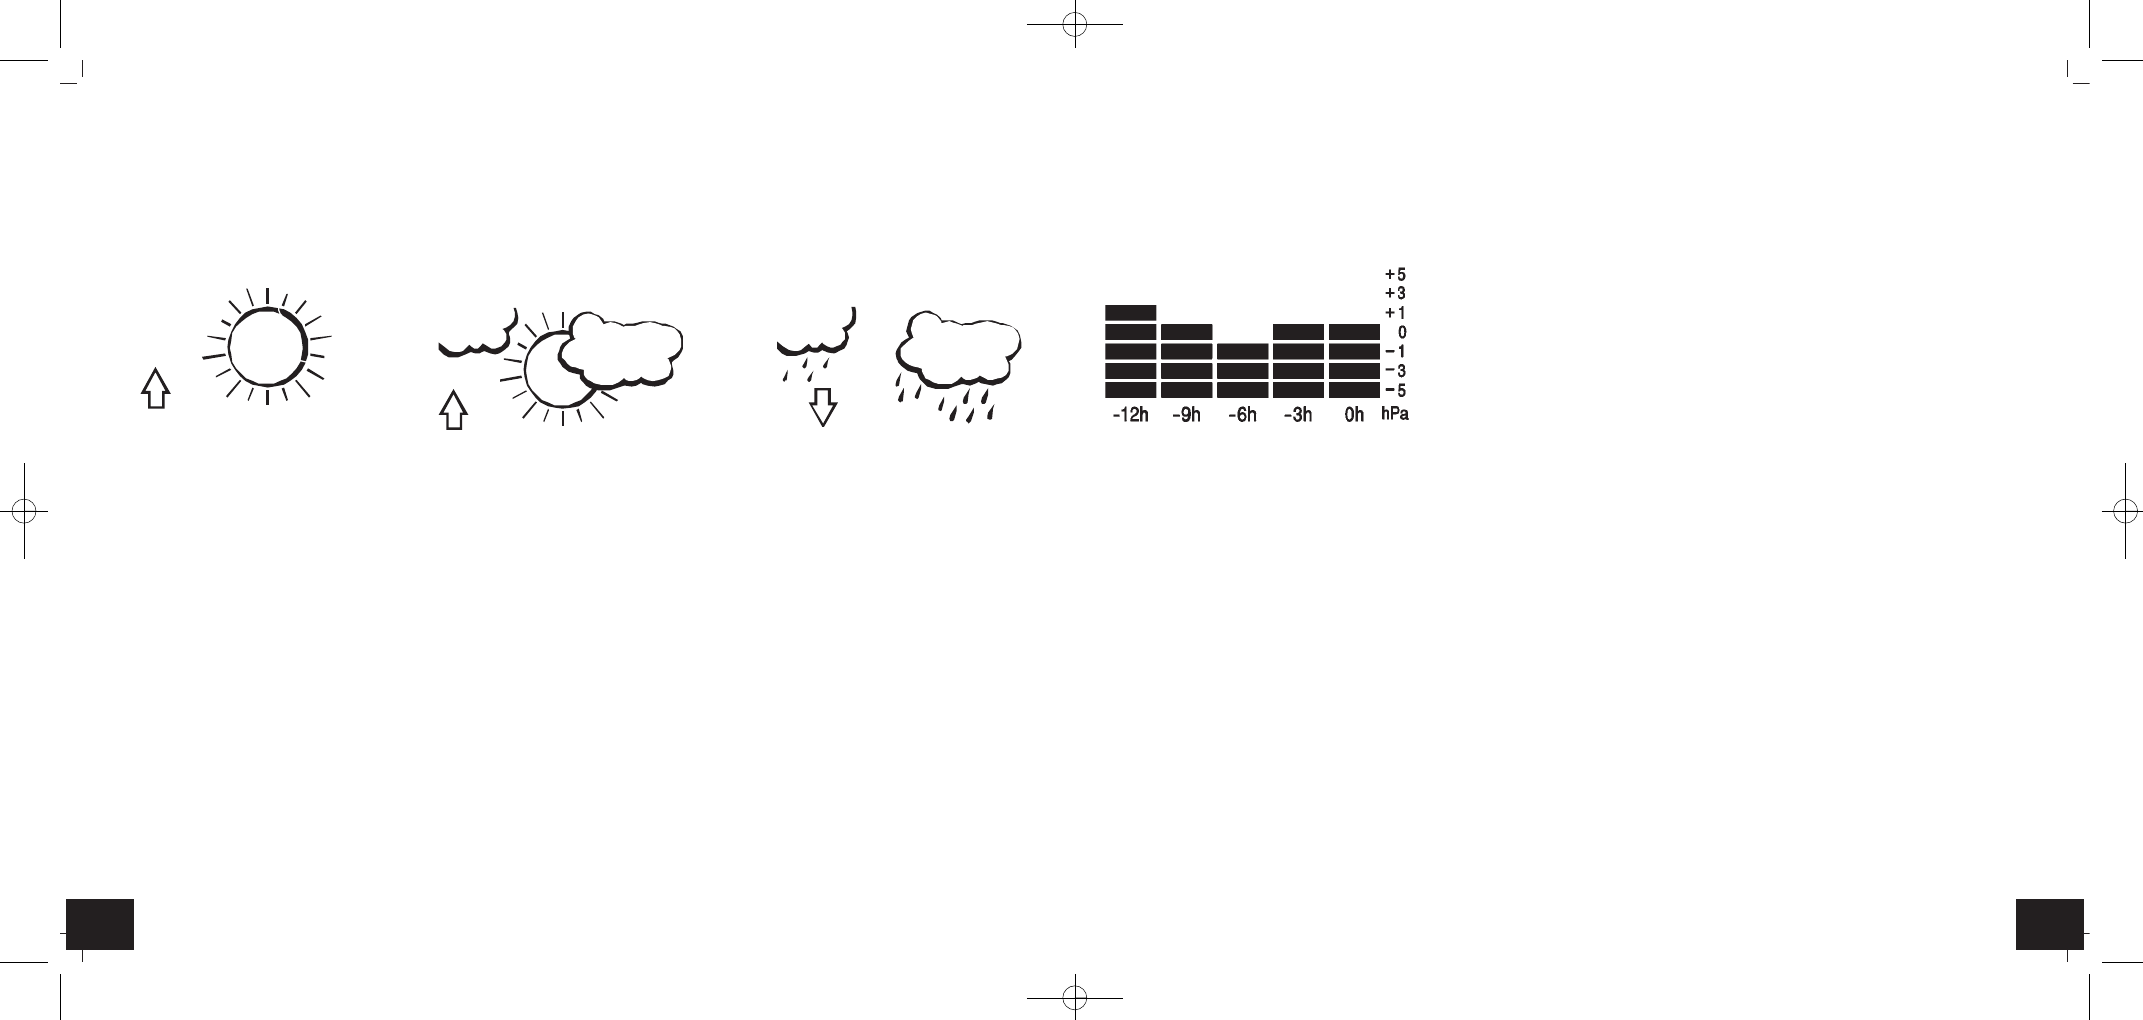
• The right side of the second section of the LCD shows the air pressure history bar graph.
• The bar graph indicates the air pressure history trend over the last 12 hours in 5 intervals: 0h,
-3h, -6h, -9h and -12h. The “0h” represents the current full hour air pressure recording. The
columns represent the “hPa” (0, ±1, ±3, ±5) at specific time. The “0” in the middle of this
scale is equal to the current pressure, and each change (±1, ±3, ±5) represents how high or
low in “hPa” the past pressure was, compared to the current pressure.
• If the bars are rising it means that the weather is getting better due to the increase of air pres-
sure. If the bars go down, it means the air pressure has dropped and the weather is expected
to get worse from the present time “0h”.
Note:
• If the weather station is moved to another location significantly higher or lower than its initial standing point (for example from the ground floor
to the upper floors of a house), discard the weather forecast for the next 12-24 hours. By doing this, the weather station will not mistake the new
location as being a possible change in atmospheric pressure, when in reality it is simply due to the slight change of altitude.
Attention: The weather forecast will not be transferred to the WeatherHub app.
7.4 Temperature and humidity
7.4.1 Maximum and minimum values
• Press the MIN / MAX button in normal mode.
• The highest indoor temperature is displayed since the last reset.
• Press the MIN / MAX button again.
• The lowest indoor temperature is displayed since the last reset.
• Press the MIN / MAX button again.
• The highest outdoor temperature with time of recording since the last reset is displayed.
• Press the MIN / MAX button again.
• The highest outdoor temperature with date of recording since the last reset is displayed.
• Press the MIN / MAX button again.
• The lowest outdoor temperature with time of recording since the last reset is displayed.
• Press the MIN / MAX button again.
• The lowest outdoor temperature with date of recording since the last reset is displayed
• Press the MIN / MAX button once more, to go back to the current values display.
• Press and hold the MIN / MAX button for two seconds while the maximum or minimum values are displayed to clear the recorded readings.
7.2.1 Activate/deactivate alarm
• Press the ALARM button in normal mode, to activate or deactivate the alarm function.
• The alarm symbol appears/disappears.
7.3 Weather forecast
7.3.1 Weather forecasting icons
• Weather icons can be displayed in any of the following combinations:
Sun Sun with cloud Cloud with rain
• For every sudden or significant change in the atmospheric pressure, the weather icons will update accordingly to represent the change in weather.
If the icons do not change, then it means either the atmospheric pressure has not changed or the change has been too slow for the weather sta-
tion to register. However, if the icon displayed is the Sun or Cloud with rain, there will be no change of icon if the weather gets any better (with
Sun icon) or worse (with Cloud with rain icon) since the represent the weather at their extremes.
• The icons displayed forecasts the weather in terms of getting better or worse and not necessarily a sunny day or a rainy day as each icon may
suggest. For example, if the current weather is cloudy and the Cloud with rain is displayed, it does not mean that the product is faulty because it
is not raining. It simply means that the atmospheric pressure has dropped and the weather is expected to get worse but not necessarily rainy.
Note:
• After setting up the weather station, the readings for the weather forecasts should be ignored for the next 12-24 hours. This will allow sufficient
time for the weather station to collect atmospheric pressure data at a constant altitude and therefore result in a more accurate forecast.
• Common to weather forecasting, absolute accuracy cannot be guaranteed. The weather forecasting feature is estimated to have an accuracy level
of about 75% due to the varying areas the weather station has been designed for use. In areas that experience sudden changes in weather (for
example from sunny to rain), the weather station will be more accurate compared to use in areas where the weather is stagnant most of the time
(e.g. mostly sunny).
7.3.2 Weather trend indicator
• The trend indicator (located on the left of the weather icons) works together with the weather icons. When the arrow points upwards, it means
that the air pressure is increasing and the weather is expected to improve; When the arrow points downwards, the air pressure is dropping and
the weather is expected to become worse.
• By taking this into account, you can see how the weather has changed or is expected to change. For example, if the arrow is pointing downwards
together with Sun with cloud icon, then the last noticeable change in weather was when it was sunny (the Sun icon only). Therefore, the next
change in weather will be Cloud with rain icon, since the arrow is pointing downwards.
TFA_No. 35.1143_Anleitung 28.11.2016 18:18 Uhr Seite 10